For the following experiment, the apparatus is
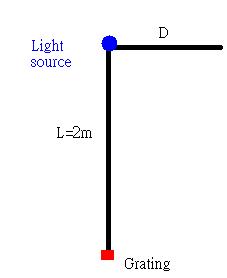
The equation to find the wavelength at distinct position is λ=(D*d)/√(L^2+D^2) where D is the spectra light's distance from the light source. L is the distance between the light source and the grating. d is the measurment of the grating.
We just look through the grating to determine the spectra lines.

1.
For experiment one, the light source will be white light (regular light bulb), and we measured the distance for the spectra light. Interesting thing about this experiment is that the light bulb has some diameter about 1.5cm;thus, we need to add this number to compensate the increase in the value of L(2.015m). By doing the experience we obtained the value of each spectra line (the midpoint of continuous spectra)
Violet | Blue | Green | Yellow | Red | |
cm+-0.5cm | 43.5 | 49.5 | 58.5 | 65 | 76 |
If we look only at the end points of the spectra lines, we range of the wavelength is gonna be 341nm~652nm±10nm
The results we got from doing the experiment is within the visible spectra, which is 380~750nm(according to wikipedia).


In this case, we do the same steps with just the white light to determine the spectra line ragnes are.
Violet | Green | Yellow | Red | |
cm+-0.5cm | 45.5~59 | 59~62.5 | 62.5~66.5 | 66.5~100 |
Violet=52.25cm±0.25cm
Green=60.75cm±0.25cm
Yello=64.5cm±0.25cm
Red=66.5cm±0.25cm
If we calculated out the wavelength of each section
we get
Violet=422nm±4nm
Green=485nm+4nm
Yellow=513nm±4nm
Red=642nm+±4nm
If we match the spectra line we have to an known gas spectra, we will get the result similar to mercury gas.
3. Lastly, we use the same method the measure the four primary lines of the hydrogen gas spectrum.
The problem we had for this experiment is that our hydrogen gas tube has a leak;thus, the light that produced is really dean that we had trouble to do this experiment. At the end, we just worked with Christ and Eric to do the experiment and obtained the data from them.
Violet/Blue | Green | Orange/Yellow | Red | |
cm+-2cm | 46.5 | 50.6 | 62.1 | 70.8 |
And to fixed the systematic error they had the equation of λ_actual=1.051λ_exp+4.538
If we calculate the numbers, we will get
Violet/Blue=378nm±11nm
Green=410nm±11nm
Orange/Yello=495nm±11nm
Red=557nm±11nm
After the calibration, the actual result is
Violet/Blue=402nm±16nm
Green=435nm±16nm
Orange/Yello=525nm±16nm
Red=590nm±16nm
And if we compare to the actual results
| Color | Frequency | Wavelength |
|---|---|---|
| violet | 668–789 THz | 380–450 nm |
| blue | 631–668 THz | 450–475 nm |
| cyan | 606–630 THz | 476–495 nm |
| green | 526–606 THz | 495–570 nm |
| yellow | 508–526 THz | 570–590 nm |
| orange | 484–508 THz | 590–620 nm |
| red | 400–484 THz | 620–750 nm |
The results are fairly close to the actual number within their uncertainties.
No comments:
Post a Comment